


Sensor Plots app for iPhone and iPad
Developer: Ajay Thakur
First release : 12 Feb 2016
App size: 4.72 Mb
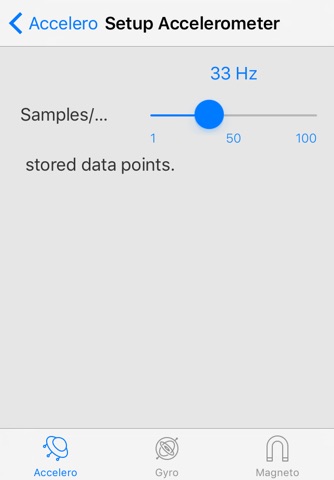
Sensor Plots is a data acquisition app. It collects the RAW data from iOS inbuilt sensors - accelerometer, gyroscope and magnetometer at a configured sample rate. You can email this data when after the data acquisition is completed. This data is raw data from device and has x, y and z components with time-interval information in .csv format. If you are learning about sensors, or teaching or developing digital signal processing algorithms this app will be invaluable to you. You can stay focused on the task and let the app collect and provide data to you for analysis.
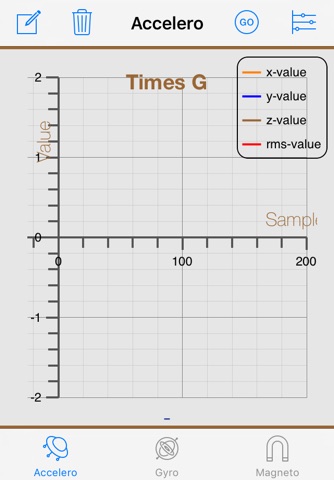
The app also shows most recent 600 samples of data in a scatter plot. This is enough for 1 minute of data collection at 10Hz sample rate. To do a more though analysis you can use R, Excel, MatLab and others to process the data.
This app is great to show your students how sensors react when they take a walk or swing with an arm. You can also show data the magnetometer reports when you bring phone near magnets or electric circuits.
You can also record data while app is running in background, if you explicitly set the background setting. Note that - continued use of GPS running in the background can dramatically decrease battery life.
Hope you learn and enjoy this app and share your learnings on youtube or other social media. If you have any feature request or feedback please email [email protected]